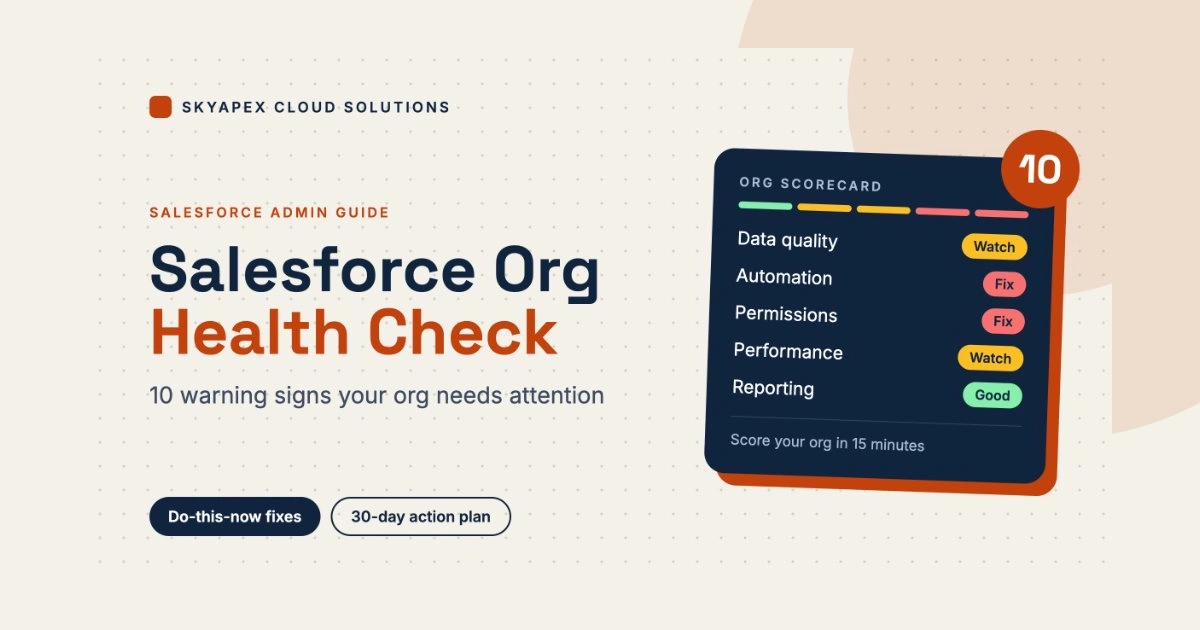
Every Salesforce org starts out clean. A handful of objects, a sensible set of fields, a couple of reports everyone understands. Then the business grows. A new sales manager wants a field. Marketing needs a different lead flow. A consultant builds an integration and moves on to the next client. Three years later, you are staring at a system that nobody fully understands, and everyone is quietly afraid to touch it.
If that sounds familiar, you’re in good company. Almost every long-running Salesforce org drifts toward complexity, and the drift is rarely dramatic. It happens one small shortcut at a time. The trouble is that by the time the symptoms become obvious, they are already costing you money, time and trust.
A Salesforce org health check is simply a structured look under the hood: data quality, automation, security, code, performance, adoption and governance. You don’t need to wait for a crisis to do one. But if you are wondering whether it is time, the ten warning signs below are the clearest signals we know of. Read them with your own org in mind and be honest about how many apply.
We wrote this guide at Skyapex Cloud Solutions for admins, sales ops leaders and IT managers who sense their org is slipping but cannot yet prove it. Under every warning sign you will find a Do this now section: a check you can run in about 15 minutes and the first fix to try. At the end there is a 30-day action plan and a checklist you can hand to your team.
1. Your Users Don’t Trust the Data (and Keep Their Own Spreadsheets)
This is the most human warning sign, and probably the most expensive. Walk over to a sales rep and ask where they track their real pipeline. If the answer is an Excel file on their desktop, your org has a credibility problem.
People stop trusting Salesforce when they have been burned by it. Maybe an opportunity showed the wrong stage in a forecast call. Maybe a customer was contacted by two different reps in the same week. Once that trust is gone, users start keeping “shadow data” elsewhere, and every shadow spreadsheet makes the official record a little less complete. It becomes a vicious circle: the data gets worse because people avoid the system, and people avoid the system because the data is bad.
What to Look For
- Reps updating records right before a pipeline review rather than as work happens
- Managers asking for “the real numbers” outside of Salesforce
- Login frequency dropping, especially among people who were once active
- Requests for exports that exist only to be manipulated elsewhere
What It Usually Means
The root cause is rarely laziness. It is typically bad data, clunky page layouts, or a process that does not match how people really work. Fix those, and adoption tends to follow.
Do This Now
- Open the Lightning Usage App and compare logins and page views by role over the last 30 days. Note any team that has dropped off.
- Ask five users one question: “What do you track outside Salesforce, and why?” Write down the answers as they say them.
- Pick the most repeated complaint and fix that first, for example by removing unused fields from the main page layout. One visible quick win rebuilds trust faster than a big project.
2. Duplicate and Incomplete Records Are Everywhere
Duplicates are the quiet tax every org pays. Two Account records for the same company. Three Contacts for one person, each with a different email address. A Lead that was converted months ago but is still being worked as if it were brand new.
The damage goes beyond mild annoyance. Duplicates split activity history across records, so nobody sees the full relationship. They inflate your lead and account counts, which makes marketing and sales reports misleading. They cause customers to receive repeated emails. And they make any future project, whether a CPQ rollout, a data warehouse sync or an AI initiative with Agentforce, harder because you are building on a shaky foundation.
Incomplete data is the twin problem. If half your Contacts have no phone number, a third of your Accounts have no industry, and the “Lead Source” field is blank on most records, then segmentation, routing and reporting all become guesswork.
Quick Test
Run a report on Accounts grouped by name and look for repeated entries. Then check how many key fields (industry, owner, country, record type) are blank. If the numbers make you wince, you have your answer.
What Helps
Salesforce’s native duplicate rules and matching rules are a decent starting point. Pair them with validation rules, required fields at the right stage of a process, and a periodic cleanup. For larger orgs, a dedicated data quality or deduplication tool may be worth the investment.
Do This Now
- In Setup, search for Duplicate Management and confirm that active matching rules and duplicate rules exist for Accounts, Contacts and Leads. If they do not, that is your first fix.
- Decide who “wins” a merge (the record with the most recent activity, or the most complete one) and write that rule in one line before anyone merges anything.
- Choose the three to five fields that drive routing and reporting, and make them required at the right stage through validation rules or page layouts.
3. Custom Fields Have Multiplied Out of Control
Open the Object Manager for Account or Opportunity and scroll. If it takes a while to reach the bottom, pay attention to what you see. Fields named “Status 2,” “Old Region,” “Temp Flag,” or “Renewal Date (New)” are classic signs of an org that adds but never removes.
Why Field Bloat Creates Real Friction
- Page layouts become long and confusing, so users skip fields or fill them in randomly.
- Nobody knows which field is the “source of truth” when two seem to store the same thing.
- Reports and integrations pick the wrong field, quietly producing wrong answers.
- You edge closer to object limits on custom fields, which can become a genuine blocker.
A useful exercise is to list every custom field alongside two columns: how many records populate it and where is it referenced (reports, flows, Apex, layouts, integrations). Fields that are almost never filled in and are not referenced anywhere are candidates for retirement. Always check dependencies before deleting anything, and take a backup of the metadata and data first.
Do This Now
- Install Salesforce Labs’ free Field Trip app to see how often each field is actually populated.
- For every low-use field, click “Where is this used?” in the field’s setup page to check reports, flows and code that depend on it.
- Don’t delete straight away. Rename the field with a
ZZ_prefix, remove it from layouts, wait 30 days, and delete it only if nobody complains. Back up the data first.
4. Performance Is Slow, and the Slowness Is Getting Worse
Some slowness is just the internet. But if users complain that record pages take forever to load, list views time out, or reports that once ran in seconds now crawl, something deeper is going on.
Common Causes
- Heavy page layouts: with too many related lists, components and embedded reports on a single Lightning page.
- Large data volumes: without proper indexing, selective filters or an archiving strategy.
- Inefficient reports: that filter on non-indexed fields or pull in enormous record sets.
- Complex automation: that fires on every save and does far more work than it needs to.
- Data skew: where a single Account owns an enormous number of child records or a single user owns a huge pile of records, leading to locking and sharing recalculation issues.
Performance issues have a nasty habit of being blamed on “Salesforce” in general when they are really the result of design choices inside your org. The good news is that design choices can be changed. Salesforce’s Lightning Usage and performance tooling, plus a careful review of your biggest objects, will usually reveal a handful of fixes that deliver outsized improvements.
Do This Now
- Open your slowest record page in Lightning App Builder and run the page analyzer.
- Check Setup > Storage Usage to see which objects hold the most data, then look at those first.
- Remove or collapse related lists nobody uses, and use component visibility so heavy components load only when they are relevant.
- For slow reports, add selective filters such as a date range, record owner or record type.
5. Automation Has Turned Into a Tangle
This one deserves extra attention, because it’s where most of the hidden risk lives.
In a mature org it is common to find the same business logic implemented in several places: an old Workflow Rule, a Process Builder, a record-triggered Flow, and an Apex trigger, all acting on the same object. Nobody planned it that way. Each was built by a different person in a different year, using whatever tool was fashionable at the time.
The Consequences of Tool Overlap
- Unpredictable behavior: because the order of execution makes results hard to reason about.
- Recursive updates: where one automation triggers another that triggers the first.
- Intermittent errors: that are difficult to reproduce in testing.
- Fear of change: since nobody knows what else will break.
There is also a platform reality to face. Salesforce stopped supporting Workflow Rules and Process Builder at the end of 2025 and pointed everyone toward Flow. Existing automations may still run, but they no longer receive fixes, and the longer you leave them, the bigger your eventual migration becomes. If your org still leans heavily on those older tools, it is a clear sign that a health check is overdue.
What a Good Outcome Looks Like
One clearly owned automation approach per object, documented naming conventions, flows that include fault handling, and a living inventory of what fires when a record is created or updated.
Do This Now
- Open Flow Trigger Explorer in Setup, pick your busiest object, and list everything that fires when a record is created or updated.
- Use Salesforce’s Migrate to Flow tool on remaining Workflow Rules and Process Builders, and test every conversion in a sandbox.
- Adopt a simple standard: one record-triggered flow per object per trigger type (before-save and after-save) is a good starting point, and every flow gets a fault path and a clear name.
6. Permissions Are a Mess (and Too Many People Are Admins)
Security problems seldom announce themselves. They accumulate. Someone needs access to a report, so they get a broader profile. A contractor is given System Administrator “just for a week” and nobody revisits it. A departing employee’s account stays active for months.
Signs Your Permission Model Needs Attention
- A long list of profiles that differ by only one or two settings
- Several people holding System Administrator who do not really need it
- Frozen or inactive users who still hold licenses and sometimes still own important records
- Sharing rules and role hierarchies that no one can explain
- “View All Data” and “Modify All Data” handed out casually
Salesforce has been steering customers toward a permission-set-led model, where profiles are kept minimal and access is layered through permission sets and permission set groups. It is easier to audit, easier to scale and far less brittle. Alongside that, the built-in Health Check tool in Setup scores your security settings against a baseline and highlights risky configurations. It will not solve everything, but it is a very quick first look.
If you handle sensitive customer or financial information, this area is not optional. A tidy permission model is both a security safeguard and a compliance asset.
Do This Now
- In Setup > Users, filter by the System Administrator profile and ask of each person: “Do they truly need this today?” Keep the list as short as the business allows.
- Pull a last-login report, freeze accounts that have been idle for 90 days, and deactivate them once you confirm nothing depends on them.
- Run the Health Check in Setup, write down your score, and fix the high-risk settings first.
- Going forward, keep profiles minimal and grant access through permission sets and permission set groups.
7. Technical Debt Is Piling Up in Your Code
If your org contains custom Apex, Lightning Web Components or integrations, that code is part of your health picture too.
How Technical Debt Shows Up
- Test classes that exist only to hit the coverage requirement, with no meaningful assertions
- Hardcoded record IDs, usernames or URLs that break the moment you refresh a sandbox
- Triggers that are not bulkified and fall over when someone loads a few hundred records
- Frequent governor limit errors, such as too many SOQL queries or CPU time exceeded
- Code written years ago against old API versions that nobody has reviewed since
- No documentation, and the original developer is long gone
What makes technical debt dangerous is that it is invisible until something big happens: a data load, a release, a new integration. Then everything breaks at once, usually at the worst possible moment.
A code review does not have to be exhausting. Start by listing every trigger, class and component, then rank them by business criticality. Examine the top ten first. Even a modest cleanup, such as replacing hardcoded IDs with custom metadata or custom labels and adding real test assertions, can dramatically reduce risk.
Do This Now
- Run all tests from Setup > Apex Test Execution and note the failures and the lowest-coverage classes.
- Search your code for 15 or 18-character record IDs. Each one is a future production incident.
- Sort the Apex Classes list by API version. Anything several years old deserves a review.
- Run Salesforce Code Analyzer for a quick scan of common problems such as queries inside loops.
8. Nobody Believes the Reports and Dashboards
Here’s a quick test. Ask three people in different teams for the current number of open opportunities or active customers. If you receive three different answers, your reporting layer has a problem.
Reports go wrong in predictable ways. Filters are defined differently from one report to the next. Dashboards run as a user who no longer has the right access. Folders are stuffed with hundreds of reports, many abandoned, many near-duplicates, and nobody knows which one is the “official” version. Leadership meetings get derailed because the first ten minutes are spent arguing about whose numbers are right.
Healthy Reporting Standards to Aim For
- A small set of certified, clearly named executive dashboards
- Shared definitions for key metrics, written down somewhere people can find
- Regular cleanup of unused reports and dashboards
- Folder structures and sharing that match how teams actually work
If you want a quick measure of the situation, count how many reports have not been run in the last year. In many orgs, the answer is a startling majority.
Do This Now
- In the Reports tab, sort by last run date. Move anything unused for 12 months into an “Archive” folder rather than deleting it.
- Write down the definition of the five numbers leadership asks for most (open pipeline, win rate, active customers and so on): object, filters, date field and owner.
- Build each number from one certified report and put it in a single shared “Executive” folder.
9. Integrations Keep Failing, or You Keep Hitting API Limits
Salesforce rarely lives alone. It talks to marketing automation, billing, ERP, support tools, data warehouses and a long list of apps from the AppExchange. Each connection is a possible failure point.
Integration Warning Signs
- Sync errors that people ignore because “it always does that”
- Records that show up in one system but not the other
- Daily API request limits being reached, which can block other processes
- Integrations built on credentials tied to a single person’s account
- AppExchange packages that are installed but unused, or whose vendors have gone quiet
Take a moment to map your integrations: what connects to what, in which direction, how often, and who owns it. That single diagram can be a revelation. You will probably find at least one integration nobody remembers authorizing, and at least one that duplicates what another already does.
And don’t forget the installed packages. Unused managed packages add clutter, can slow things down, and sometimes carry licensing costs that quietly continue each year.
Do This Now
- Open Setup > System Overview and compare your API request usage against your limit.
- Open Setup > Installed Packages and mark every package nobody can explain.
- Check that every integration uses its own dedicated integration user and Named Credentials, not a real person’s login.
- Draw a simple integration map with four columns: system, direction, frequency and owner. Add a fifth: what happens when it fails.
10. There Is No Governance, Documentation or Release Discipline
This last sign is the root of many of the others. If changes are made directly in production by whoever happens to have access, if there is no record of why something was built, and if the entire org lives in one administrator’s memory, you are running on luck.
Tell-Tale Patterns of Zero Governance
- Sandboxes that are months or years out of date, so testing proves little
- No consistent process for requesting, approving and deploying changes
- Naming conventions that vary wildly from one admin to the next
- A “bus factor” of one, meaning the loss of a single person would leave the org unmanageable
- Competing requests from departments with no one deciding priorities
Governance sounds bureaucratic, but a lightweight version is surprisingly effective. A simple intake form, a monthly prioritization meeting, a shared change log and a basic deployment pipeline (even just change sets with a checklist, or a source-controlled approach for larger teams) can transform how smoothly the org evolves. The point isn’t to slow people down. It’s to make sure every change is deliberate rather than accidental.
Do This Now
- Open the Setup Audit Trail and review the last 30 days. Were any changes made directly in production that nobody planned?
- Check when each sandbox was last refreshed and set a refresh schedule.
- Start a shared change log with four columns: date, what changed, why, and who did it.
- Name a second person who can run the org, and walk them through the basics.
How Many of These Warning Signs Apply to You?
Count them honestly:
- 0 to 2 signs: You are in decent shape. Schedule a light review once or twice a year and keep an eye on the areas where you ticked a box.
- 3 to 5 signs: Your org is showing real strain. A focused health check, followed by a prioritized cleanup, will likely pay for itself quickly.
- 6 or more signs: Don’t panic, but don’t wait either. This level of accumulated debt is hurting adoption, slowing delivery and raising risk. It is time for a structured assessment and a realistic remediation roadmap.
How to Run a Salesforce Org Health Check
You don’t need a huge project to begin. Here’s a practical sequence that works for most teams:
- Step 1: Get a baseline. Use the tools Salesforce already gives you. The Health Check page in Setup reviews your security settings. Salesforce Optimizer surfaces unused fields, large page layouts, inactive flows and similar issues. The Setup Audit Trail shows who has been changing what over the past six months.
- Step 2: Talk to your users. Numbers tell part of the story, but people tell the rest. A handful of short conversations with reps, service agents and managers will quickly reveal where the real pain is. Ask what annoys them, what they work around, and what they wish Salesforce did.
- Step 3: Inventory the big areas. Catalog your automation, integrations, custom code, profiles and permission sets, and installed packages. Even a rough spreadsheet is far better than nothing.
- Step 4: Rank by risk and value. Not every problem deserves immediate action. Sort findings by two questions: how likely is it to cause damage, and how much would fixing it help the business? Quick wins go first. Risky and valuable items follow.
- Step 5: Fix, document, and set a rhythm. Clean up in small, safe batches, in a sandbox first. Document what you change. Then make health checks a habit, perhaps quarterly for lightweight reviews and annually for a deeper audit.
Your 30-Day Action Plan
Don’t try to fix everything at once. This structured schedule sequences quick wins first so users immediately feel positive momentum, followed by data, automation, and governance stabilization.
| Timeline | Operational Focus Area | Key Deliverables & Artifacts |
|---|---|---|
| Week 1 |
Baseline Diagnostic & User Discovery
Run native Setup Health Check, audit the 6-month Audit Trail, and conduct 15-minute interviews with five frontline users. |
✓ Diagnostic Findings Sheet: A RAG (Red/Amber/Green) scorecard rating each of the 10 warning signs across your production org. |
| Week 2 |
Immediate Quick Wins & Security Hardening
Prune unneeded System Administrator profiles, deactivate 90-day idle accounts, archive stale reports, and clean top layout friction. |
✓ Visible Adoption Improvements: A trimmed admin list, reduced security exposure score, and noticeably cleaner page layouts for sales reps. |
| Week 3 |
Data Quality & Automation Consolidation
Activate native duplicate & matching rules, schedule low-usage custom field retirement, and map object automation inventory. |
✓ Technical Debt Cleanup Backlog: Prioritized flow migration plan, active lead deduplication barriers, and retirement schedule for unused fields. |
| Week 4 |
Release Governance & Ongoing Cadence
Establish a production change log, establish sandbox refresh intervals, implement change request forms, and cross-train a backup admin. |
✓ Org Governance Framework: One-page change protocol, sandbox refresh calendar, and an established bi-annual health check cadence. |
Salesforce Org Health 10-Point Audit Worksheet
Use this structured diagnostic worksheet during your next architecture review, sprint planning, or quarterly CRM checkup. Review each domain, run the 15-minute diagnostic test, and mark your org's health status to identify where technical debt is silently accumulating:
Salesforce Org Health 10-Point Audit Scorecard
Benchmark your production environment across 10 mission-critical architecture domains. Run each 15-minute diagnostic check, tally your flags, and uncover high-risk technical debt before it impacts your pipeline.
User Data Trust & Offline Spreadsheets
Duplicate Records & Missing Mandatory Data
Custom Field Proliferation & Zombie Fields
Lightning Page Load Speed & EPT Degradation
Flow Clashes, Recursion & Legacy Automations
Admin Privilege Creep & Orphaned Accounts
Apex Debt, Flaky Unit Tests & Hardcoded IDs
Report Proliferation & Conflicting Metrics
API Limits & Unused Managed Packages
Release Governance & Sandbox Cadence
Risk Score Interpretation Matrix
Add up your total “Fix” and “Watch” ratings to determine your org’s risk tier:
Final Thoughts
A Salesforce org is not a one-time build. It is closer to a garden: it needs regular attention, some pruning, and the occasional bold decision to pull something out by the roots. Ignore it for long enough and it still grows, but in directions you did not choose.
The ten warning signs above aren’t meant to alarm you. They’re meant to help you notice. Most of them are fixable, and many can be improved with a few weeks of focused effort. The real danger isn’t having a messy org. It’s not realizing how messy it has become until a failed release, a security incident or a frustrated executive forces the conversation.
So take an hour this week. Open your org, run through the list, and see how many signs ring true. That small act of paying attention is where every healthy Salesforce org begins.
How Skyapex Cloud Solutions Can Help
You can run every check in this guide yourself. If you would rather have an experienced second pair of eyes, or your team simply does not have the bandwidth, Skyapex Cloud Solutions can run the complete health check with you. We review the same ten areas covered here and deliver a prioritized remediation roadmap, so you know what to fix first, what can wait, and exactly what it will take.
- A structured Salesforce org health check across data, automation, security, code, performance, reporting and integrations
- Data cleanup, deduplication, and data migration stabilization
- Migration of legacy Workflow Rules and Process Builders to high-performance Salesforce Flow
- Permission model redesign using permission sets and permission set groups
- Governance setup: change management, sandbox strategy, and living documentation
If three or more of the warning signs sounded familiar, get in touch with the Skyapex Cloud Solutions architecture team to book an org health check.